Other things of note
Maps
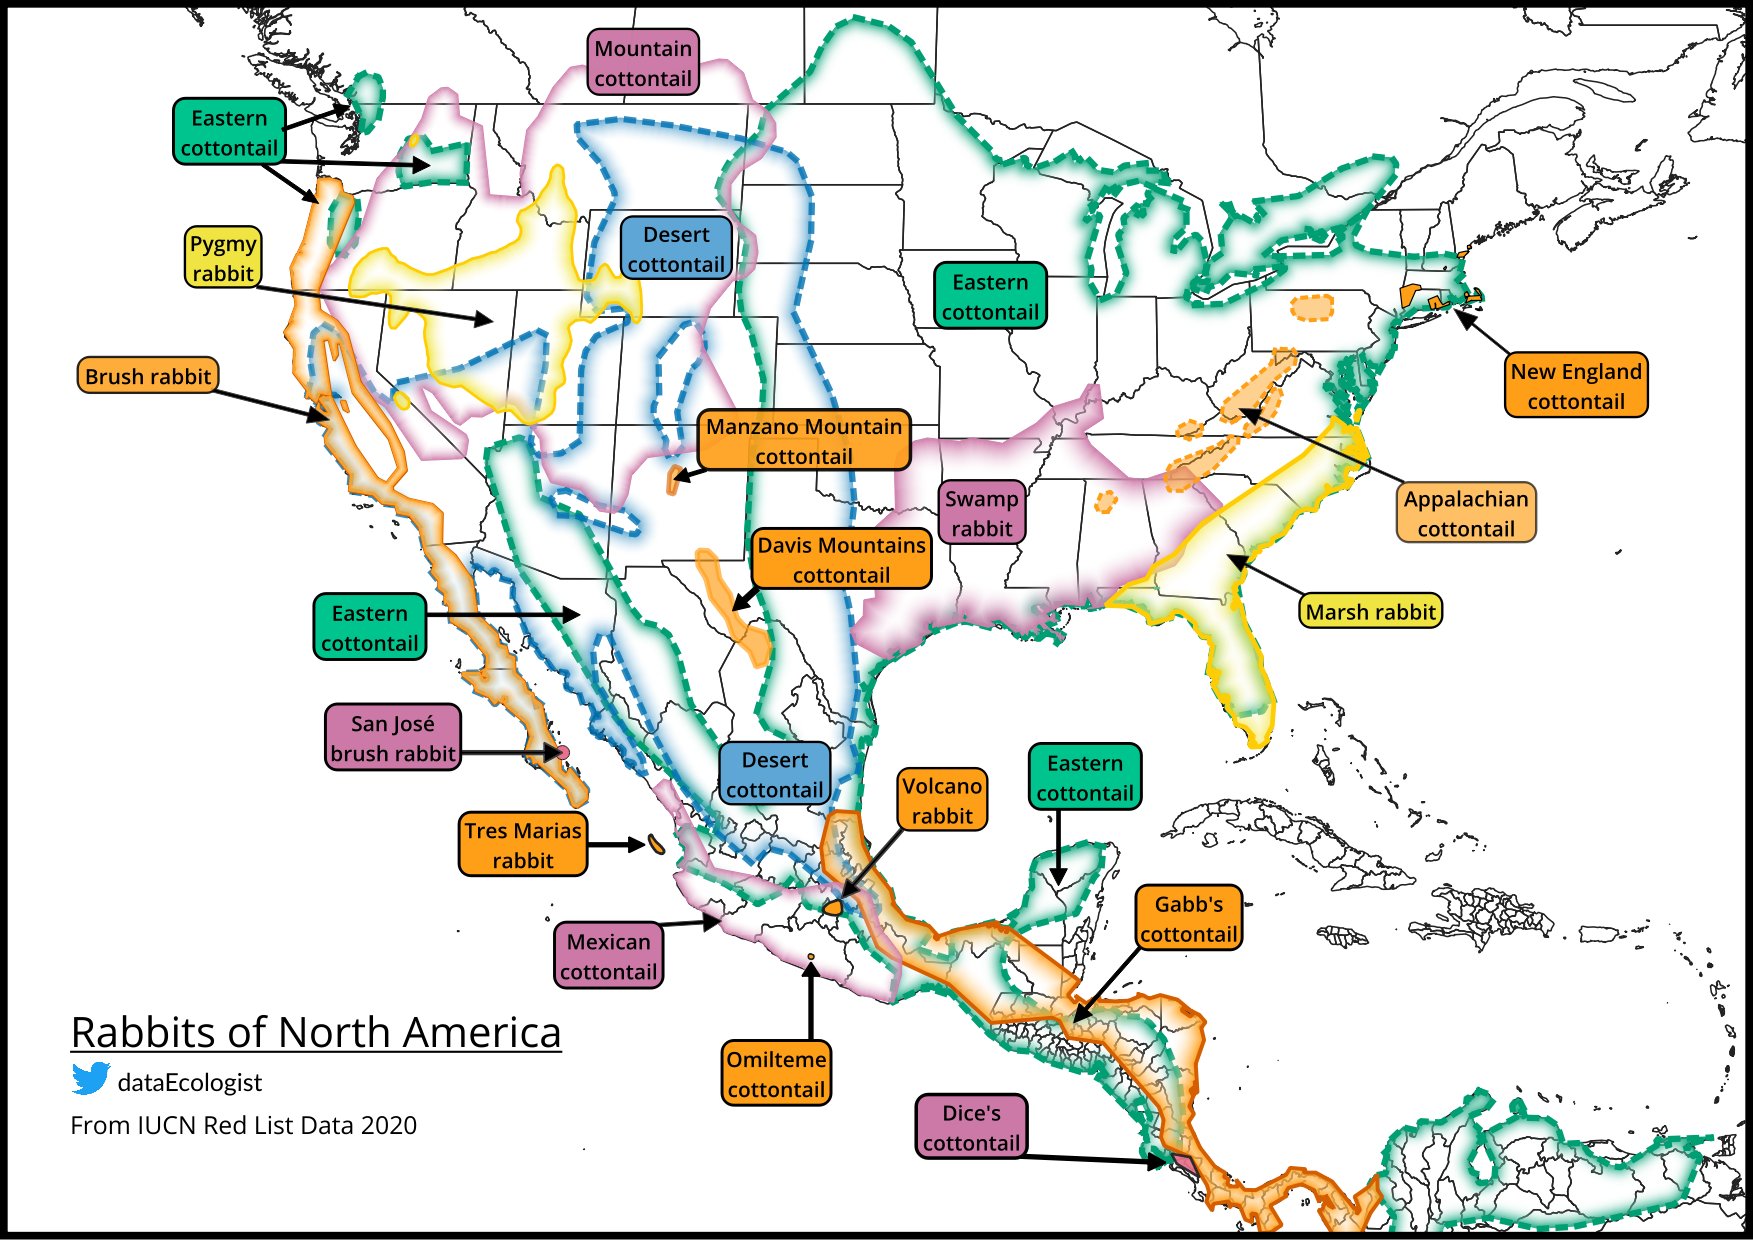
Rabbits of North America
Made using QGIS and data from IUCN Red List.

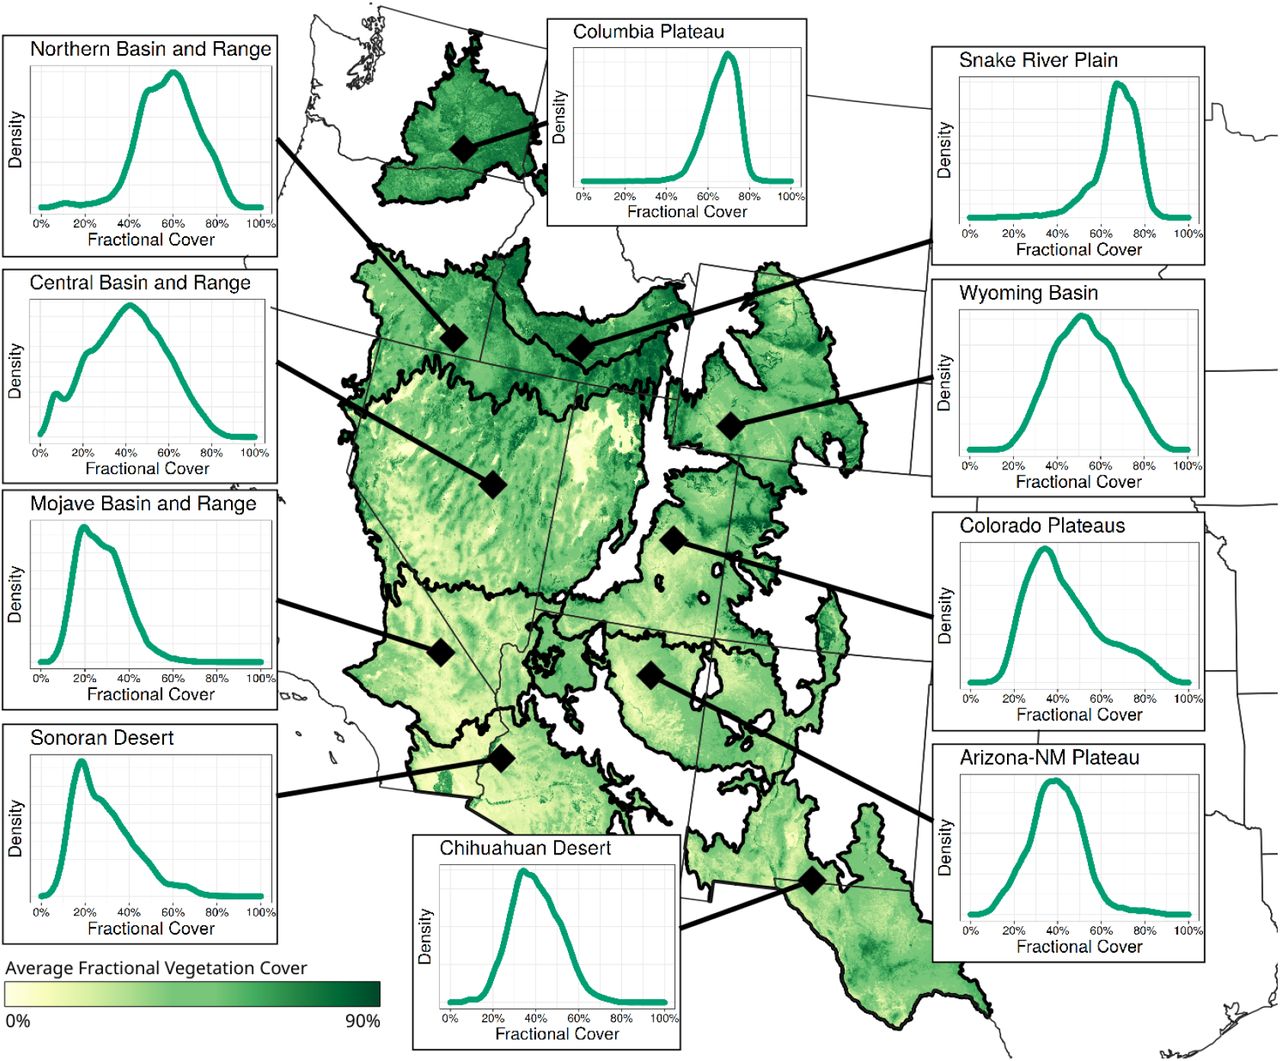
Vegetation Cover in drylands
Made with a combination of QGIS and R for the publication Taylor et al. 2021.

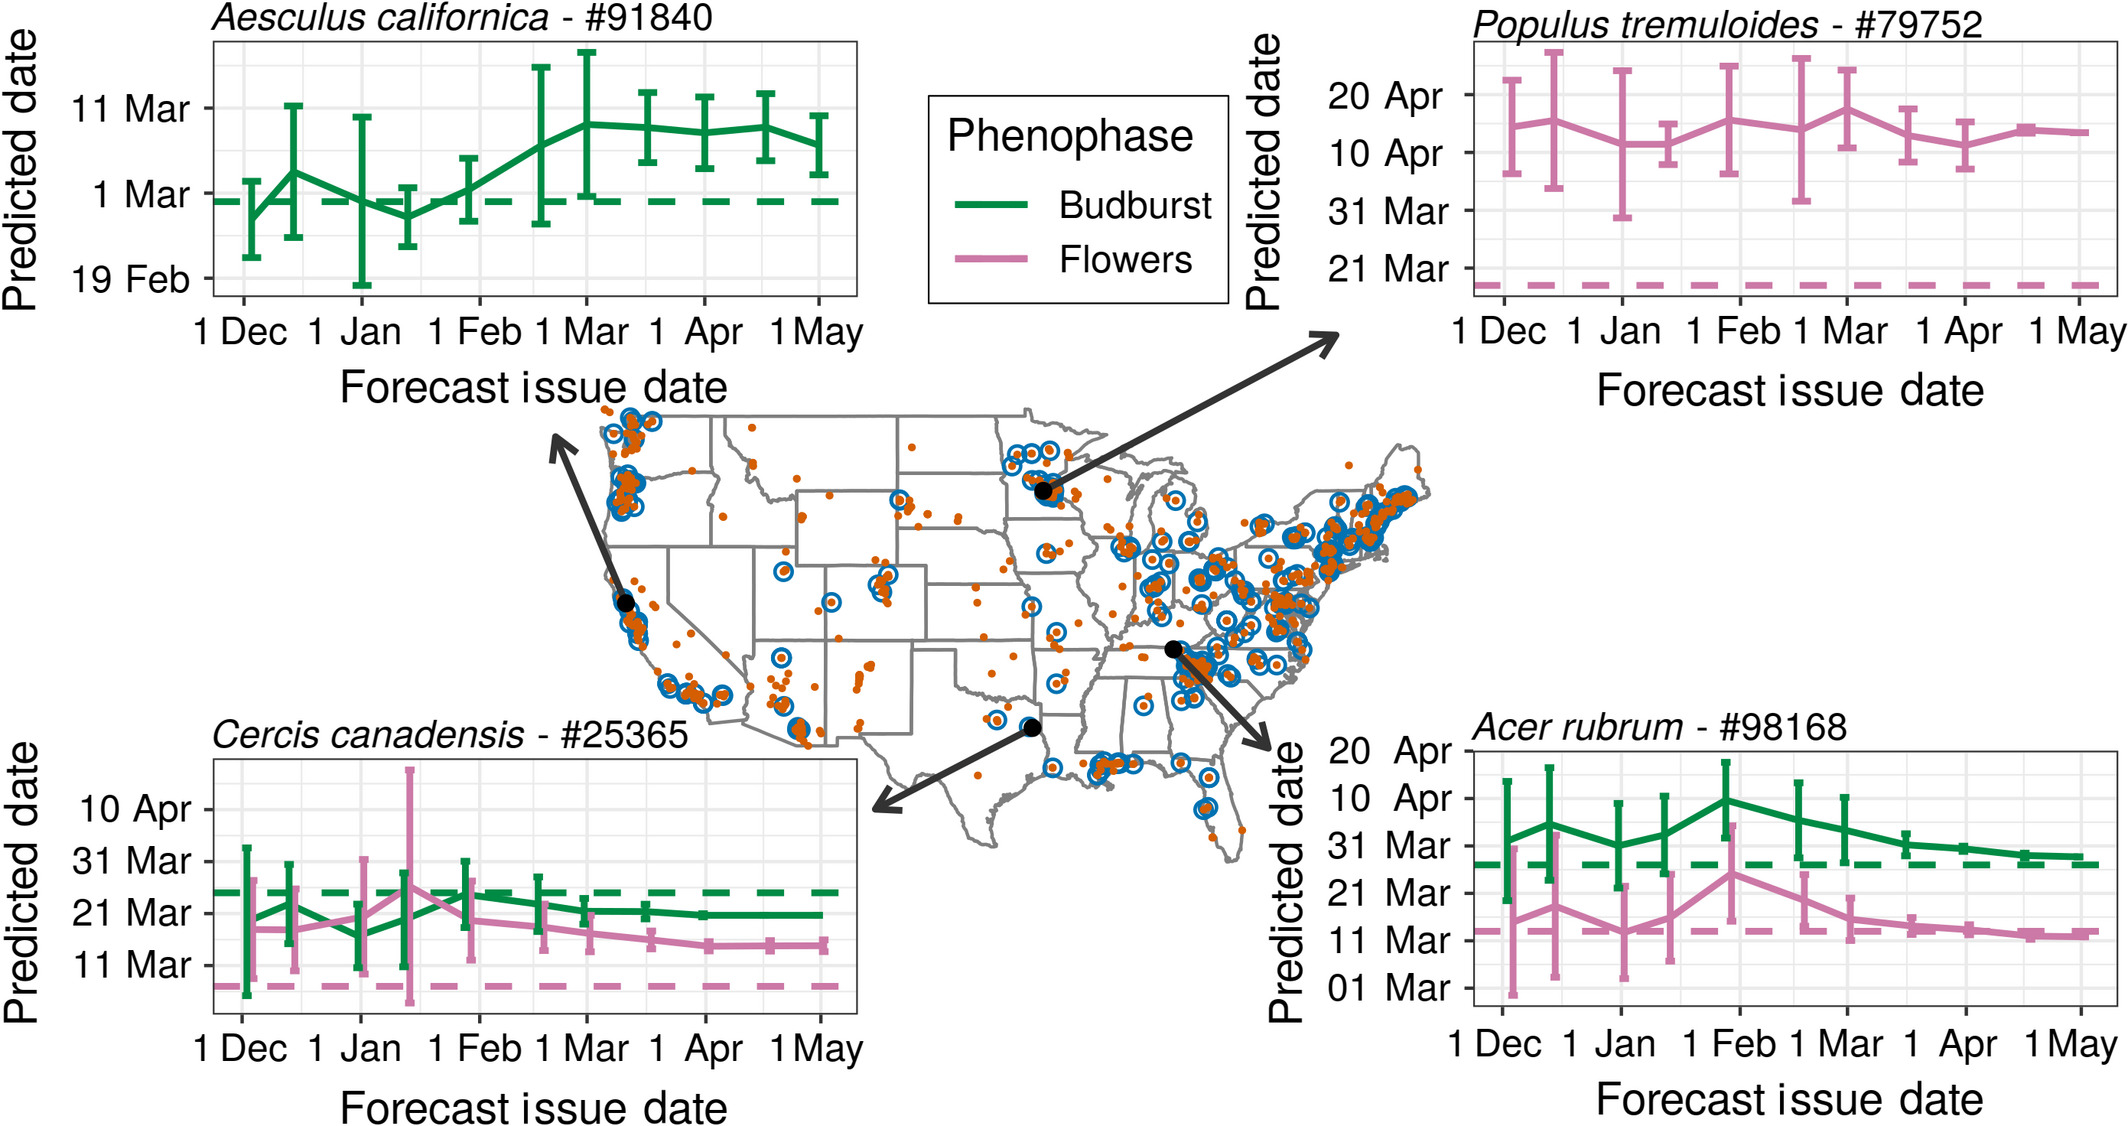
Phenology forecast evaluation
Made 100% in R for the publication Taylor & White 2020.

Tutorials
So you want to run your R or python script on the HiperGator - A non-technical introduction to using high performance clusters.
Complex figure examples - A gallery of scientific figures and the code to make them.
